Next: Partial Derivatives Up: Multivariable Calculus with Maxima Previous: Arc Length and Curvature Contents
Now let's try some multivariate functions.
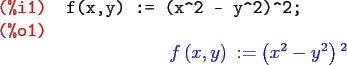
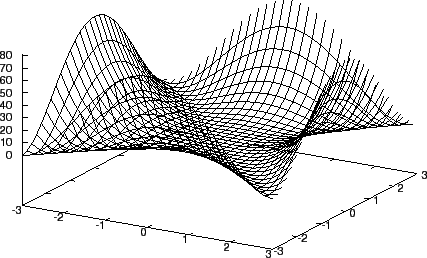
Let's take a look at a plot.
![\begin{maximasession}
load(draw);
draw3d(explicit(f(x,y), x, -3, 3, y, -3, 3));
...
...eft[ \mathrm{gr3d}\left(\mathrm{explicit}\right) \right] \\
\end{maximasession}](img77.png)
See Figure BLANK.
The important part is to enclose the function with explicit(). We can get a fancier, colored plot if we put enhanced3d = true at the beginning of the function call.
![\begin{maximasession}
draw3d(enhanced3d = true, explicit(f(x,y), x, -3, 3, y, -3...
...eft[ \mathrm{gr3d}\left(\mathrm{explicit}\right) \right] \\
\end{maximasession}](img79.png)
We can see level curves (also known as a contour map) of the function f with the following:
![\begin{maximasession}
draw3d(explicit(f(x,y), x, -5, 5, y, -5, 5),
contour_lev...
...eft[ \mathrm{gr3d}\left(\mathrm{explicit}\right) \right] \\
\end{maximasession}](img81.png)
An alternative is to use
![\begin{maximasession}
contour_plot(f(x,y), [x, -5, 5], [y, -5, 5] );
\maximaoutp...
...(x,y), [x, -5, 5], [y, -5, 5] ); \\
\o6. \mathbf{false} \\
\end{maximasession}](img82.png)
The contour map is a 2D plot. If we raise the contour lines up to the plot surface then the lines are more precisely called horizontal traces. Here is a plot of these.
![\begin{maximasession}
draw3d(enhanced3d = true,
explicit(f(x,y), x, -3, 3, y, -...
...eft[ \mathrm{gr3d}\left(\mathrm{explicit}\right) \right] \\
\end{maximasession}](img84.png)
See Figure 6. We do surfacehide = true so that we can see the traces better.