Next: Line Integrals Up: Vector Fields Previous: Gradient vector fields Contents
This is almost identical to the 2D case, except that we need to account for ![]() in the code and use draw3d instead of draw2d.
in the code and use draw3d instead of draw2d.
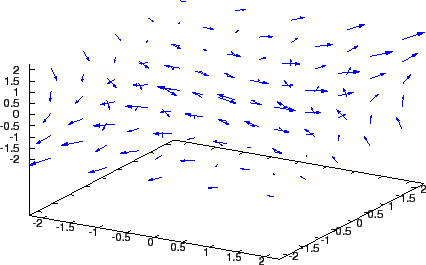
Note that with 3d plots the graph can be dynamically moved around with the mouse to look from different angles. Also note that the arrows in a vector field plot are often times difficult to see because of their length. I usually scale them down to see the relationships better.
Let's plot the vector field
![\begin{lstlisting}[basicstyle={\ttfamily }]
coord: setify(makelist(k,k,-2,2));
p...
...,k[3]),k,points3d);
apply(draw3d, append([color=blue], vect3));
\end{lstlisting}](img204.png)
See Figure BLANK.